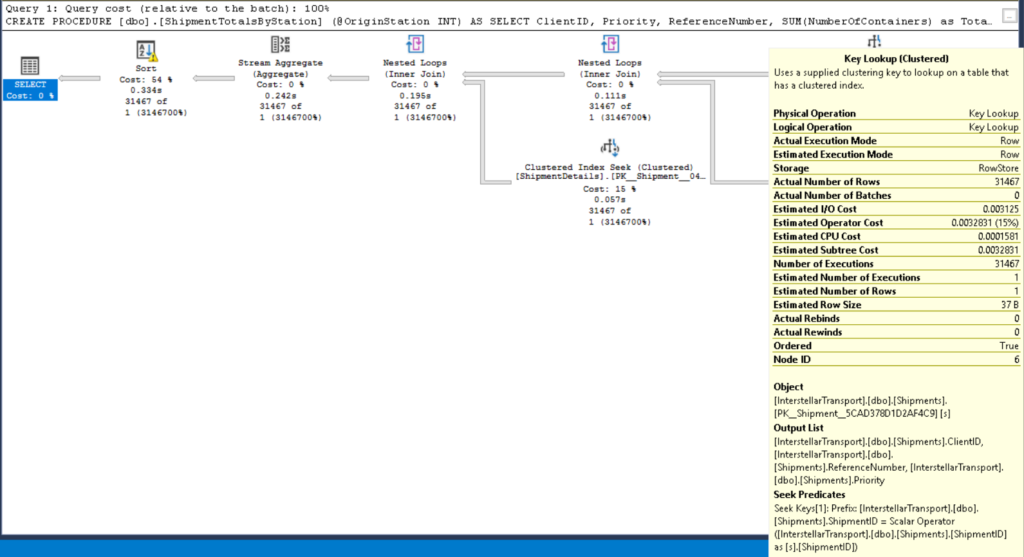
Getting the actual execution plan, that is the plan with run-time statistics for a query from an application has always been a little difficult. It’s fine if you can get the query running in Management Studio and reproducing the behaviour from the app, but that can be difficult.
There’s the query_post_execution_showplan event in Extended Events, but that’s a pretty heavy event and not something that I’d like to run on a busy server.
No more! SQL 2019 adds a new plan-related function to get the last actual plan for a query: sys.dm_exec_query_plan_stats.
The function is not available by default, Last_Query_Plan_Stats database scoped configuration has to be set to allow it to run, and it’s going to add some overhead, how much is still to be determined.
ALTER DATABASE SCOPED CONFIGURATION SET LAST_QUERY_PLAN_STATS = ON
It’s a function which takes a parameter of a plan handle or a sql handle. Hence it can be used alone, or it can be on the right-hand side of an apply from any table or DMV that has a plan handle or sql handle in it. As an example it can be used with QueryStore.

WITH hist
AS (SELECT q.query_id,
           q.query_hash,
           MAX(rs.max_duration)  AS MaxDuration
    FROM
        sys.query_store_query q INNER JOIN sys.query_store_plan p ON q.query_id = p.query_id
        INNER JOIN sys.query_store_runtime_stats rs ON p.plan_id = rs.plan_id
        INNER JOIN sys.query_store_runtime_stats_interval rsi ON rs.runtime_stats_interval_id = rsi.runtime_stats_interval_id
    WHERE start_time < DATEADD(HOUR, -1, GETDATE())
    GROUP BY q.query_id, query_hash),
recent
AS (SELECT q.query_id,
           q.query_hash,
           MAX(rs.max_duration)  AS MaxDuration
    FROM
        sys.query_store_query q INNER JOIN sys.query_store_plan p ON q.query_id = p.query_id
        INNER JOIN sys.query_store_runtime_stats rs ON p.plan_id = rs.plan_id
        INNER JOIN sys.query_store_runtime_stats_interval rsi ON rs.runtime_stats_interval_id = rsi.runtime_stats_interval_id
    WHERE start_time > DATEADD(HOUR, -1, GETDATE())
    GROUP BY q.query_id, query_hash),
regressed_queries
AS (
    SELECT hist.query_id,
            hist.query_hash
        FROM hist INNER JOIN recent ON hist.query_id = recent.query_id
        WHERE recent.MaxDuration > 1.2*hist.MaxDuration
    )
SELECT st.text, OBJECT_NAME(st.objectid) AS ObjectName, qs.last_execution_time, qps.query_plan
    FROM sys.dm_exec_query_stats qs
        CROSS APPLY sys.dm_exec_sql_text (qs.sql_handle) st
        OUTER APPLY sys.dm_exec_query_plan_stats(qs.plan_handle) qps
    WHERE query_hash IN (SELECT query_hash FROM regressed_queries)
The above query checks query store for any query that has regressed in duration in the last hour (defined as max duration > 120% of previous max duration) and pulls the last actual plan for that query out.

And a look at that plan tells me that I have a bad parameter sniffing problem, a problem that might have been missed or mis-diagnosed with only the estimated plan available.
